1. Khái niệm :
Hàm ax.contour3D () tạo biểu đồ đường bao ba chiều. Nó yêu cầu tất cả dữ liệu đầu vào phải ở dạng lưới thông thường hai chiều, với dữ liệu Z được đánh giá tại mỗi điểm. Ở đây, ta sẽ trình bày một biểu đồ đường bao ba chiều của một hàm hình sin ba chiều.
from mpl_toolkits import mplot3d
import numpy as np
import matplotlib.pyplot as plt
def f(x, y):
   return np.sin(np.sqrt(x ** 2 + y ** 2))

x = np.linspace(-6, 6, 30)
y = np.linspace(-6, 6, 30)

X, Y = np.meshgrid(x, y)
Z = f(X, Y)

fig = plt.figure()
ax = plt.axes(projection='3d')
ax.contour3D(X, Y, Z, 50, cmap='binary')
ax.set_xlabel('x')
ax.set_ylabel('y')
ax.set_zlabel('z')
ax.set_title('3D contour')
plt.show()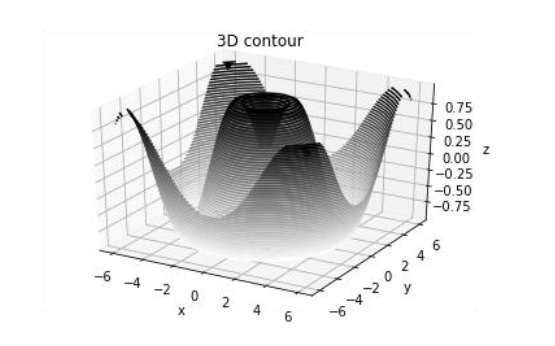
2. Ví dụ :
Ví dụ 1 : Lines plot
import matplotlib as mpl
from mpl_toolkits.mplot3d import Axes3D
import numpy as np
import matplotlib.pyplot as plt

mpl.rcParams['legend.fontsize'] = 10

fig = plt.figure()
ax = fig.gca(projection='3d')
theta = np.linspace(-4 * np.pi, 4 * np.pi, 100)
z = np.linspace(-2, 2, 100)
r = z**2 + 1
x = r * np.sin(theta)
y = r * np.cos(theta)
ax.plot(x, y, z, label='parametric curve')
ax.legend()

plt.show()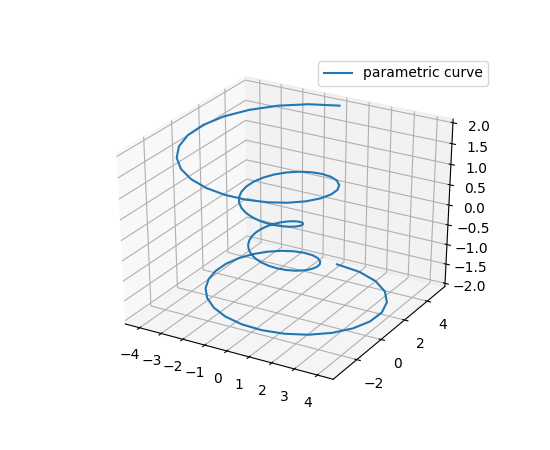
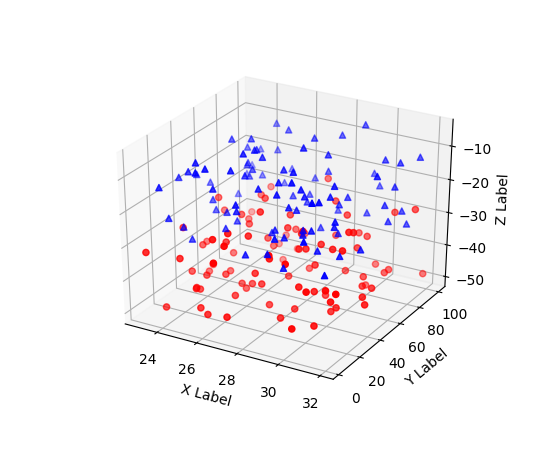
Ví dụ 2 : Scatter Plot
'''
==============
3D scatterplot
==============

Demonstration of a basic scatterplot in 3D.
'''

from mpl_toolkits.mplot3d import Axes3D
import matplotlib.pyplot as plt
import numpy as np


def randrange(n, vmin, vmax):
    '''
    Helper function to make an array of random numbers having shape (n, )
    with each number distributed Uniform(vmin, vmax).
    '''
    return (vmax - vmin)*np.random.rand(n) + vmin

fig = plt.figure()
ax = fig.add_subplot(111, projection='3d')

n = 100

# For each set of style and range settings, plot n random points in the box
# defined by x in [23, 32], y in [0, 100], z in [zlow, zhigh].
for c, m, zlow, zhigh in [('r', 'o', -50, -25), ('b', '^', -30, -5)]:
    xs = randrange(n, 23, 32)
    ys = randrange(n, 0, 100)
    zs = randrange(n, zlow, zhigh)
    ax.scatter(xs, ys, zs, c=c, marker=m)

ax.set_xlabel('X Label')
ax.set_ylabel('Y Label')
ax.set_zlabel('Z Label')

plt.show()