1. Khái niệm cơ bản :
Biểu đồ quiver hiển thị các vectơ vận tốc dưới dạng mũi tên với các thành phần (u, v) tại các điểm (x, y).
quiver(x,y,u,v)Đoạn code trên vẽ các vectơ dưới dạng arrow tại các tọa độ được chỉ định trong mỗi cặp phần tử tương ứng trong x và y.
Các tham số :
Bảng sau liệt kê các thông số khác nhau cho plot Quiver:
| x | Mảng 1D hoặc 2D. Tọa độ x tại các vị trí arrow |
|---|---|
| y | Mảng 1D hoặc 2D. Tọa độ y tại các vị trí arrow |
| u | Mảng 1D hoặc 2D. Các thành phần x của vectơ arrow |
| v | |
| c |
Ví dụ :
import matplotlib.pyplot as plt
import numpy as np
x,y = np.meshgrid(np.arange(-2, 2, .2), np.arange(-2, 2, .25))
z = x*np.exp(-x**2 - y**2)
v, u = np.gradient(z, .2, .2)
fig, ax = plt.subplots()
q = ax.quiver(x,y,u,v)
plt.show()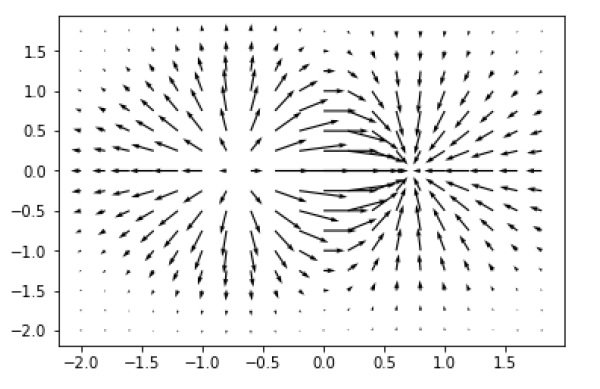
2. Các ví dụ minh hoạ :
Ví dụ 1 :
import matplotlib.pyplot as plt
import numpy as np

X = np.arange(-10, 10, 1)
Y = np.arange(-10, 10, 1)
U, V = np.meshgrid(X, Y)

fig, ax = plt.subplots()
q = ax.quiver(X, Y, U, V)
ax.quiverkey(q, X=0.3, Y=1.1, U=10,
             label='Quiver key, length = 10', labelpos='E')

plt.show()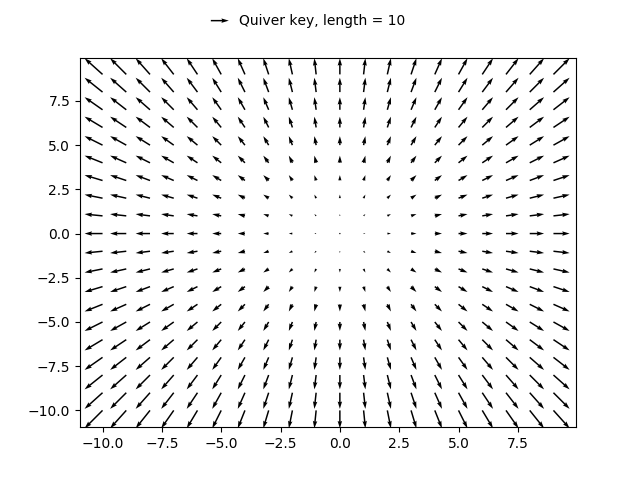
Ví dụ 2 :
import matplotlib.pyplot as plt
import numpy as np

X, Y = np.meshgrid(np.arange(0, 2 * np.pi, .2), np.arange(0, 2 * np.pi, .2))
U = np.cos(X)
V = np.sin(Y)
fig1, ax1 = plt.subplots()
ax1.set_title('Arrows scale with plot width, not view')
Q = ax1.quiver(X, Y, U, V, units='width')
qk = ax1.quiverkey(Q, 0.9, 0.9, 2, r'$2 \frac{m}{s}$', labelpos='E',
coordinates='figure')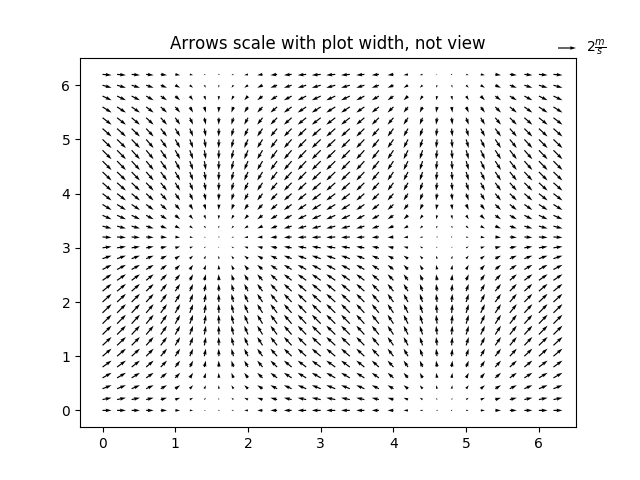
fig2, ax2 = plt.subplots()
ax2.set_title("pivot='mid'; every third arrow; units='inches'")
Q = ax2.quiver(X[::3, ::3], Y[::3, ::3], U[::3, ::3], V[::3, ::3],
               pivot='mid', units='inches')
qk = ax2.quiverkey(Q, 0.9, 0.9, 1, r'$1 \frac{m}{s}$', labelpos='E',
                   coordinates='figure')
ax2.scatter(X[::3, ::3], Y[::3, ::3], color='r', s=5)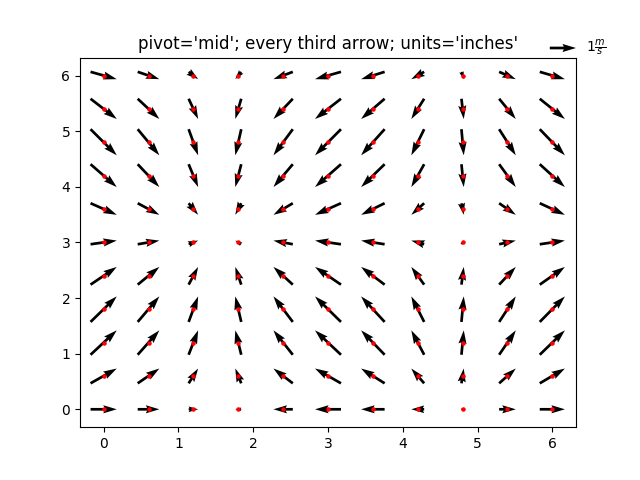
# sphinx_gallery_thumbnail_number = 3
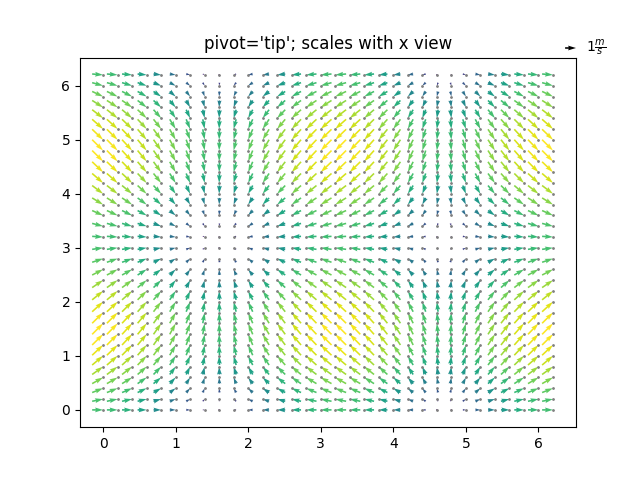
fig3, ax3 = plt.subplots()
ax3.set_title("pivot='tip'; scales with x view")
M = np.hypot(U, V)
Q = ax3.quiver(X, Y, U, V, M, units='x', pivot='tip', width=0.022,
scale=1 / 0.15)
qk = ax3.quiverkey(Q, 0.9, 0.9, 1, r'$1 \frac{m}{s}$', labelpos='E',
coordinates='figure')
ax3.scatter(X, Y, color='0.5', s=1)
plt.show()